MID AMERICA APARTMENT COMMUNITIES (MAA)·Q4 2025 Earnings Summary
MAA Beats Core FFO But Stock Slides on Cautious Recovery Timeline
February 5, 2026 · by Fintool AI Agent
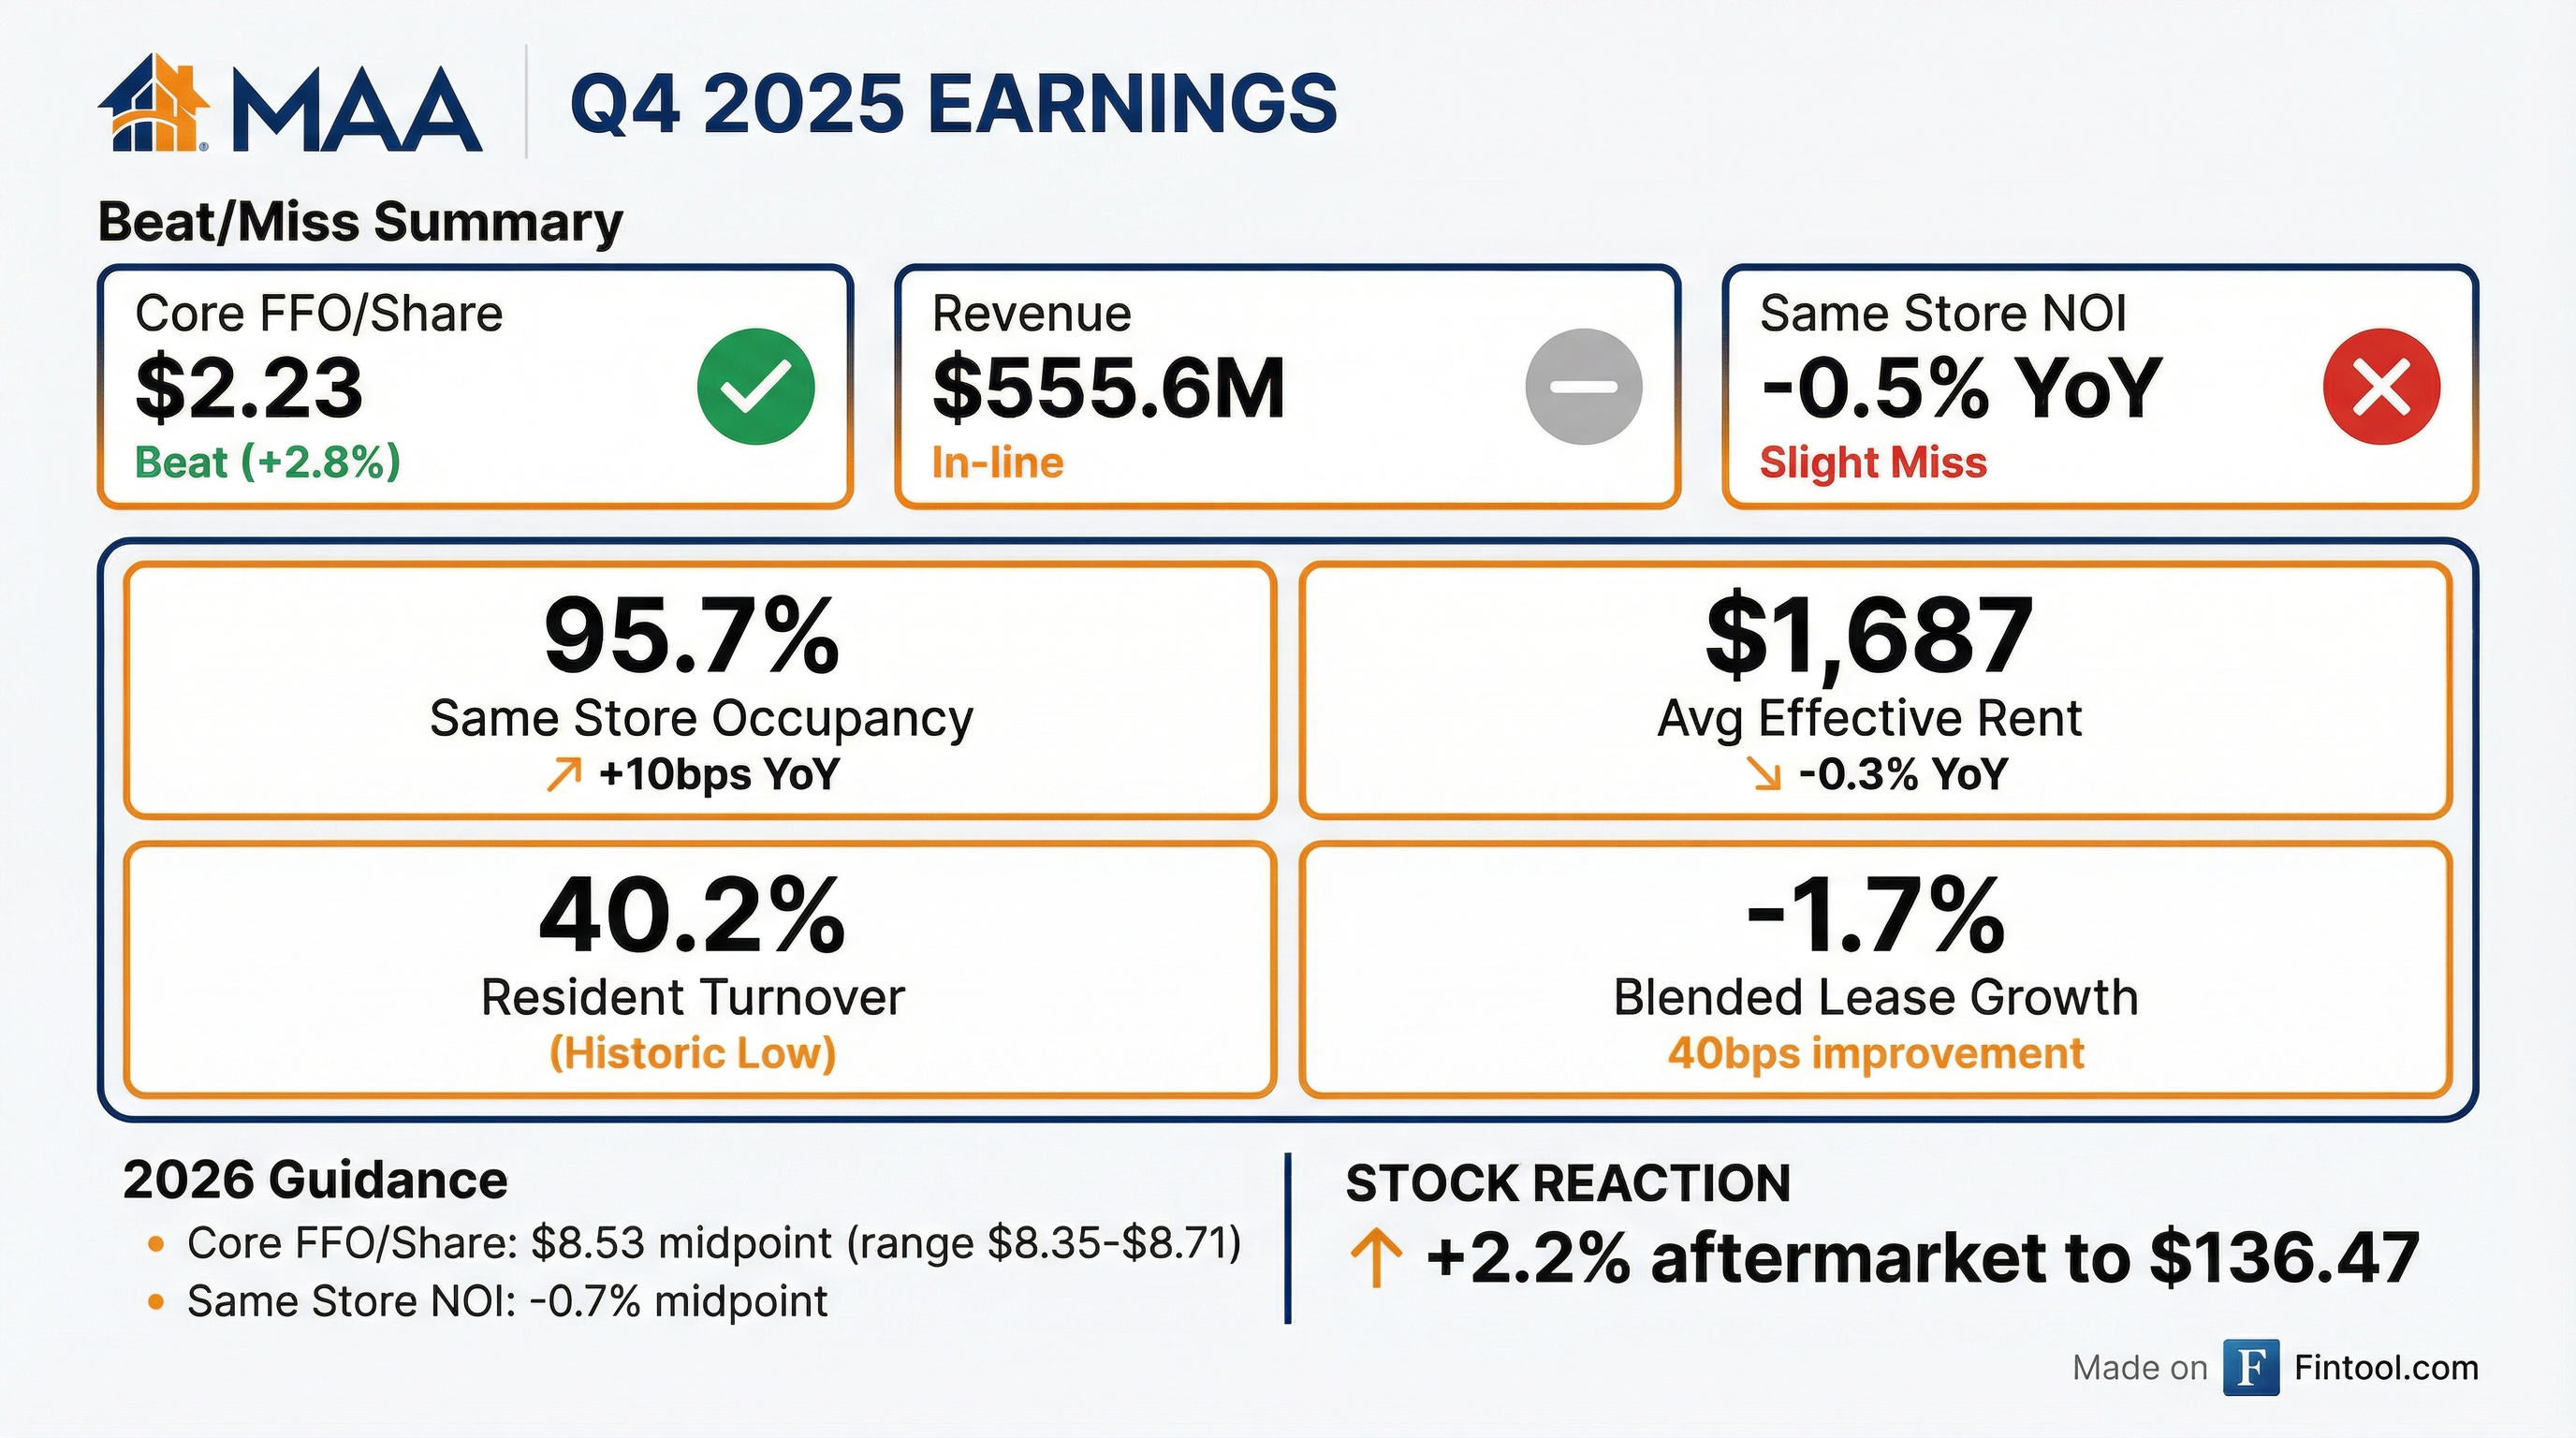
Mid-America Apartment Communities (MAA) delivered Q4 2025 results that beat Core FFO expectations, but the stock fell -2.5% to $130.50 following an earnings call where management signaled new lease pricing would remain negative through 2026. While blended lease rates are improving (+40 bps YoY), the recovery timeline appears more extended than investors hoped.
Management struck an optimistic tone about the emerging recovery cycle, citing four consecutive quarters of improving blended pricing and new supply deliveries down 60% from peak levels. However, analysts pushed back on the timeline to positive new lease growth — and management declined to commit to a specific quarter.
Did MAA Beat Earnings?
Yes — MAA beat on the metric that matters most for REITs.
Core FFO of $2.23 was "in line with the midpoint of our fourth quarter guidance" with Same Store revenues one cent unfavorable (offset by favorable expenses). Management noted this matched Q4 2024 exactly despite the challenging supply environment.
What Did Management Guide?
MAA provided initial 2026 guidance that reflects cautious optimism — a modest decline in Core FFO offset by improving fundamentals in the back half of the year.

Guidance Building Blocks from the Call:
- Same Store revenue midpoint of +0.55% driven by: -0.2% earn-in (improvement vs 2025), 1%-1.5% blended lease pricing, 95.6% occupancy, and 2%+ other revenue growth
- Same Store expenses at +2.65%: Personnel <2%, utilities and marketing higher
- Non-Same Store expected to contribute $0.19 in NOI
- Interest expense up 15%+ driven by: $300M bond refinancing from 1.2% to current rates, preferred share redemption, development financing
- Overhead up 5% to $136M (3-year average: 2.5%)
For Q1 2026 specifically, MAA guided Core FFO of $2.05-$2.17 (midpoint $2.11), down from $2.23 in Q4 due to seasonal factors and overhead timing.
Q&A Highlights: What Analysts Pushed Back On
Timeline to Positive New Lease Growth — Multiple analysts pressed on when new lease rates would turn positive. Management declined to commit, noting improvement should accelerate "particularly in 2027 as pressure from supply subsides throughout the year."
Blended Rate Acceleration Skepticism — Analysts noted the ~200 bps implied ramp from H1 to H2 was similar to last year, when guidance was subsequently cut. Management countered that this year is different: "More of that impacting new lease rates is going to impact 2027 more so on the revenue side than 2026 because of it being a little more backloaded."
RealPage Settlement — Asked about the pending settlement, management stated: "The settlement is no admission of wrongdoing or liability. It does not require any material changes to how we operate the business. The prospective commitments are all ones that we believe are consistent with how we conduct operations today." Two ongoing attorney general matters remain.
Share Buyback Philosophy — Management explained the first repurchase since 2001: "We're trading at a sizable discount persistently. We really have not done that, if you go back and look at our history, in a long, long time." But emphasized limited appetite given development pipeline priorities.
Development Focus Amid Earnings Pressure — Challenged on prioritizing development when lease-ups are taking longer and interest costs exceed capitalization, management defended: "The concessions that we're offering are burning off. If you look at the recurring rents that are in place on those development projects right now, they're 2% above pro forma. This is a temporary issue."
Concession Trends — About two-thirds of direct comps are offering concessions averaging 5 weeks; lease-ups are offering 8-10 weeks. Management noted concessions have improved in Dallas and Atlanta urban areas, but picked up slightly in Nashville, Raleigh, and Charlotte.
How Did the Stock React?
MAA shares closed at $130.50, down -2.5% on the day following the earnings call, reversing the prior day's +1.3% gain on the initial results release. The stock is now trading at:
- 15.3x forward FFO (based on $8.53 guidance midpoint)
- 4.7% dividend yield ($6.12 annual dividend)
- -25% from 52-week high of $173.38
The negative reaction suggests investors were disappointed with the extended timeline to recovery. When pressed on when new lease growth would turn positive, management declined to commit — noting 2027 as the likely inflection point.
What Changed From Last Quarter?
Four consecutive quarters of YoY blended improvement — this is the key trend management emphasized. Q4 2025 blends (-1.7%) were 40 bps better than Q4 2024 (-2.1%), supported by 50 bps renewal improvement and flat new lease rates YoY.
CEO Brad Hill: "The recovery in fundamentals is underway. As we look ahead, we are entering 2026 in a stronger position with a higher earn-in and more top-line revenue momentum that we expect to build throughout the year."
2026 Lease Rate Expectations from the Call:
- Blended: 1% - 1.5% (110-160 bps improvement vs 2025)
- Renewals: ~5.25% throughout the year
- New leases: Still negative, but improving — expect "gradual seasonal improvement" with "less moderation in late Q3 and Q4 than we typically do"
What Is Management's Outlook?
Management struck their most optimistic tone in several quarters, citing multiple tailwinds — though the timeline to full recovery is measured in years, not quarters.
Supply Relief Is Here: New deliveries are down over 60% from peak in 2026. New starts have been muted for nearly three years, down nearly 70% from peak levels. Management projects 340,000-350,000 jobs in their markets in 2026, with completions at half that level — a significant improvement in the job-to-completion ratio.
Demand Remains Solid: Strong collections with net delinquency at just 0.3% of billings. Renewal acceptance rates above 5% for January, February, and March (vs. 4.5% in Q1 2025). Management noted "record levels of resident retention" and "sector-leading resident Google scores averaging 4.7 out of 5 for the year."
New Lease Pricing Recovery — But When?: Management expects "gradual seasonal improvement in new lease rates" but declined to predict when rates turn positive. Key quote: "As we get into 2027, I think that's when you see real sustained momentum and start to see potentially where we get into some of those positive new lease rate ranges."
Winter Storm Fern Impact: The storm impacted about 70% of the portfolio and slowed traffic for several days, but occupancy held at 95.6% entering February with 60-day exposure of 7.1% — in line with the prior year. Insurance proceeds expected to cover damage costs.
Capital Allocation Highlights
Development Pipeline: $932M active pipeline. During Q4, acquired a shovel-ready project in Scottsdale, Arizona from a developer "unable to line up equity after three years of due diligence." In Q1 2026, purchased land in Arlington, Virginia's Clarendon neighborhood for a 287-unit community starting later this year. Expects to start 5-7 new projects in 2026 delivering into 2028-2029.
Interior Unit Upgrades: Completed 1,227 units in Q4, 5,995 for full year. Rent increases of $95 above non-upgraded units with 19% cash-on-cash return. Upgraded units lease 11 days faster than non-renovated units. Program expanding by 10%+ in 2026.
Community-Wide Wi-Fi: 14 of 23 retrofit projects now live, remaining 9 expected in Q1 2026. Despite vendor challenges and equipment delivery delays, management plans to expand initiative in 2026.
Common Area Repositioning: Over 70% repriced at six recent projects with average NOI yield above 10%. Five additional projects underway with repricing in mid-2026, six more starting later this year for 2027 repricing.
Share Buybacks: Repurchased 207,000 shares at $131.61 average — first buyback since 2001. Management cited persistent discount to NAV but emphasized limited appetite given development opportunities.
Balance Sheet: Net Debt/EBITDA of 4.3x. $880M in combined cash and borrowing capacity. Outstanding debt approximately 87% fixed with average maturity of 6.4 years at effective rate of 3.8%. Will refinance $300M of 1.2% bonds maturing September 2026 and redeem outstanding preferred shares in H2.
Key Geographic Performance
Urban vs. Suburban: Management noted differentiation emerging — urban areas showing 40 bps better blended pricing and 10 bps higher occupancy as downtown supply gets absorbed.
Risks and Concerns
-
New Lease Pricing Timeline Uncertain: Management declined to commit to when new lease rates turn positive, pushing expectations to 2027. The ~$180-185 gap between renewals and new lease rates is "higher than long-term averages" but consistent with recent quarters.
-
Interest Rate Sensitivity: Interest expense projected to increase over 15% in 2026, contributing >$0.25/share headwind. Bond refinancings will reset 1.2% paper to current rates.
-
Development Lease-Up Pressure: Elevated concessions (8-10 weeks) and longer lease-up periods have "pushed the full earnings contribution from these out about a year." Non-same-store portfolio expected to be only "slightly accrued" to 2026 Core FFO.
-
RealPage Litigation Ongoing: While the multi-district settlement requires "no material changes to operations," two attorney general matters remain active.
-
Renewal Premium Sustainability: With renewals at 5%+ and new leases deeply negative, the renewal-to-new gap creates retention risk if concessions at competitive properties become more attractive. Management counters that "when you think about the concessions on lease-ups... that's a short-term thing. You're going to get that big increase when you try to renew if you are willing to move."
The Bottom Line
MAA delivered a clean beat on Core FFO, but the stock sold off as the earnings call revealed a more extended recovery timeline than investors hoped. Management's refusal to commit to positive new lease growth in 2026 — pointing instead to 2027 — signals this is still a "show me" story.
The bull case remains intact: supply is declining sharply (-60% from peak), demand is solid (340K-350K jobs expected in MAA markets), and operating initiatives (Wi-Fi, renovations, repositioning) are generating double-digit returns. At 15.3x forward FFO and a 4.7% dividend yield, the valuation may already discount the extended recovery.
The bear case: Interest expense headwinds, development dilution, and uncertain new lease pricing make 2026 a trough year with limited earnings visibility. The renewal-to-new lease gap ($180-185) could create retention risk if concessions become more attractive.
Key catalysts to watch: Spring leasing season (Q2 2026), new lease pricing trajectory, and whether management's 2027 optimism materializes in 2026 exit rates.
Related: MAA Company Overview | Q3 2025 Earnings | Q4 2025 Transcript